So, plotting a graph is not an easy thing to do. You have to keep a lot of things in mind. So, at first, you have to draw the axes properly and choose the correct units. This is important because otherwise there are high chances that your graph would not yield any meaning at all. Therefore, putting the correct units is very important in finding the resultant value that you want to get. However, this is not the only complication of manually plotting a graph. So, there are a number of them. The line of best fit tries to simplify a couple of them. So, the following sections will show you what is the line of best fit and when exactly do you need it. Moreover, they will also show you how to draw it on a graph properly.

Now, think about two situations. At first, imagine you are drawing a velocity vs time graph. So, this graph is going to give you the acceleration of the body in motion. Let us say that the velocity of the moving body is not constant. Now, consider you do not have the values with you as well. So, from given values of displacement and time, at first, you have to calculate the velocity. After this, you must plot it on the graph. Therefore, if you make a calculation error there, everything goes wrong.
Why do you need the line of best fit?
Now, consider this case. So, you are in your school’s physics lab. You have an experimental set-up before you, let us say of an electric circuit. However, you know nothing more than that. Therefore, you have to carry out the experiment, find out the needed values and then trace them. However, it is not a theory class. When you are out doing practical, everything might not be as perfect as they are in books. So, there might be unwanted resistance or heat which distorts your values. Therefore, when you have received the values, you plot them on the graph.
However, often you will find that for a straight line graph, all the points cannot yield a straight line. So, some of them are on the right side, or some are on the left side. Therefore, the more readings you take, the more the number of distorted values you will get. However, you cannot think of joining together all the points. This is because if you do so, what you will get is a set of crooked kinks instead of a proper line. So, if you consider all these stray values, there are high chances that you would not get a suitable answer. Therefore, here the line of best fit comes to play. So, you must learn how to draw the line of best fit at first. Once you learn to do this, the process is going to be much easier. So, in the following section, we will see what a line of best fit means. Moreover, we will also see how to get it on your graph.
Line of best fit meaning
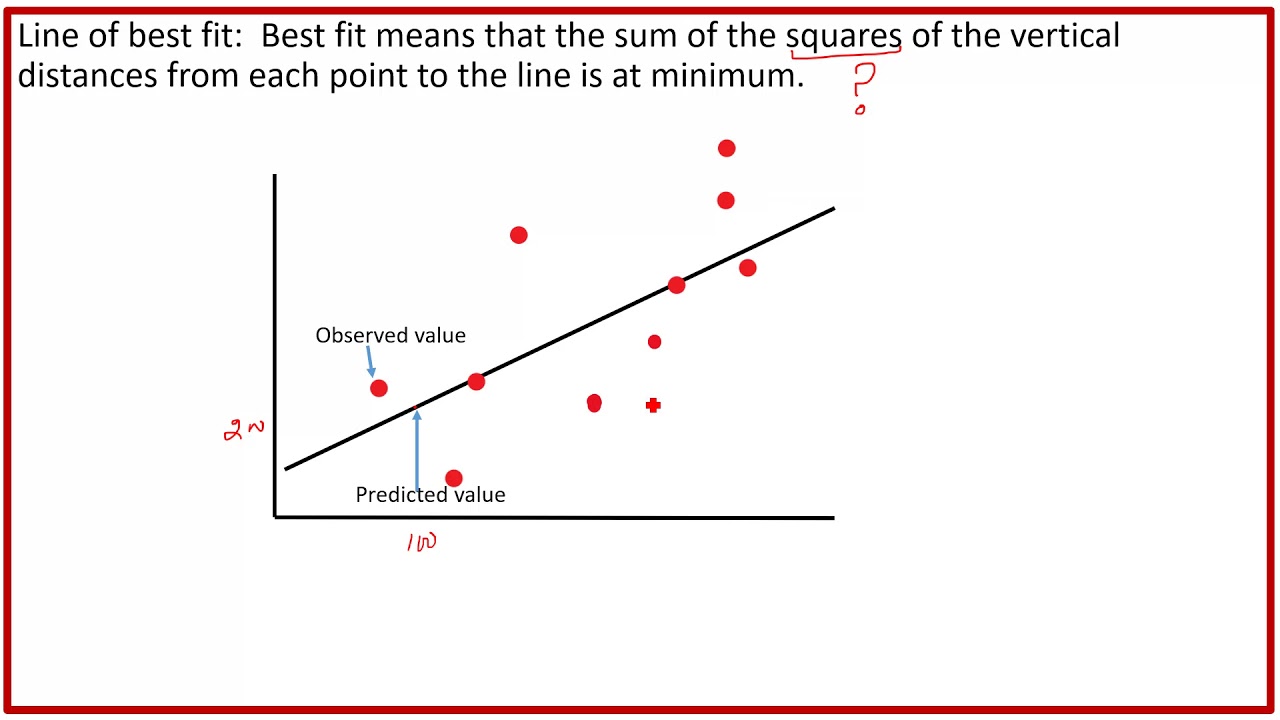
So, as we already saw, plotting a graph needs a lot of patience and caution. A slight mistake here and there can mar the entire graph. Therefore, all your labor and calculations can go to waste. It is the same as the line of fit too. Let me explain it a little. So, suppose you have got an array of points on your graph. If you join them, you get nothing like a straight line. But, you are sure that your observations and calculations all along are perfect. So, what you do is draw a straight line. Now, how to draw this? You draw the line in a way that goes over the points that best explain your equation. In other words, the line must cut through the points which when put on the equation will yield the values that you expected to get.
This, therefore, is the line of best fit. However, keep one thing in mind. The line of best fit generally cuts through most of the points. This is because only a few exceptional points can go stray. However, it might so happen that your line of best fit cuts through only three out of ten points that you have plotted. It is rare but not impossible. So, what happens is, suppose you have calculated the slope of a graph.
Read Also: FOIL Method | FOIL Calculator | Definition, Steps & Examples
Now, let us say, you draw a line that cuts through five out of ten points. However, from this line, you did not get the correct slope. So, this is not the line that best explains your graph. However, consider there is a line that cuts through only two points but satisfies your equation. Therefore, this is your line of best fit. So, it does not really depend on the number of points that cut through.

Line of best fit is not a solution to your mistakes
So, as we have already seen, there might be more points outside the line of best fit than on it. Therefore, you can have points on both sides of the line of best fit. However, they must be nearby. This means that they should have ideally been on this line. But, due to some physical parameters, there have been minor distortions. However, it is not totally impossible to get stray points. So, there might be a few points that are located very far away from the line of best fit. However, they should not be more than one or two. If they are more than that, you can rest assured that you have done something wrong. So, chances are you might need to redo the whole experiment.
Moreover, the line of best fit does not solve your mistakes. So, suppose you have plotted all the experimental values. Now, you see a graph before you with points all over. Do not think that they are just minor distortions if they are not minor. The line of best fit cannot manage the mayhem of points. If your points are in mayhem, it clearly means you have made a mistake. However, these mistakes can be both calculative, or observational, or both.
Line of best fit definition
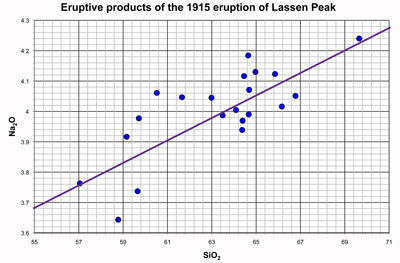
So, now we have understood what the line of best fit is. Moreover, we have also seen how to draw it on a graph. Therefore, now we must see how scientists have defined the line of best fit formally. So, the line of best fit refers to a line through a scatter plot of data points that best expresses the relationship between those points. Although I have referred to experiments inside your physics lab for greater relatability, statisticians use this concept the most. So, what it gives is an approximation of the given set of data.
Moreover, ideally, the number of pints should be the same on both sides of the line of best fit. However, that is not always how it works. Moreover, one thing is very important. It might so happen that your line of best fit does not cut through a single point. It might still best explain the graph. This is because it might so happen that you selected a line cutting through three points and the rest are very far away. Their presence is not felt. So, it at all does not work that way.
Line of best fit statistics
So, statisticians generally use the least-squares method. Therefore, this helps them to arrive at the geometric equation for the line of best fit. This is possible either through manual calculations or through regression analysis software. So, consider there is a simple linear regression analysis of two or more independent variables. What will result from it is a straight line. On the other hand, you can also have a regression that involves multiple related variables. This, however, produces a curved line of best fit in some cases. Moreover, one of the most important outputs of regression analysis is the line of best fit.
But the question is what is regression? So, regression in Statistics means a quantitative measurement. This measures the relationship between one or more independent variables and a dependent variable that results from these. So, professionals widely use regression. It finds application in a lot of sectors like science, public service to even financial analysis.
So, the next question that automatically comes is what does a statistician need for the process? So, to do this, a statistician collects a set of data points. Moreover, each of these points has a complete set of dependent and independent variables.
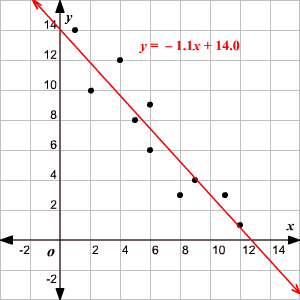
Line of best fit equation
So, you do have an equation that can give you the line of best fit on your graph. You can always use it to get the perfect line. It is nothing but the equation of a straight line. However, when you nullify it and put the proper value, you can always find out what you are looking for.
So, the equation for the line of best fit is-
y = mx + c
Now here as we all know, m is the slope of the line that we need to find. Moreover, “c” is the intercept. So, when you are dealing with the y-axis, your x-axis value must be 0. So, this then gives the value of the y-intercept. On the other hand, when you are dealing with the x-axis, your y-axis value must be 0. Therefore, in this case, the variable “c” gives the value of the x-intercept. The Y-intercept is the distance between the origin and where the line cuts on the Y-axis. On the other hand, the X intercept is the distance between the origin and where the line cuts on the X-axis.
Line of best fit calculator
Now, we have already seen the equation which will help us get the line of best fit. But, it does not end there. Putting the values is very important. A slight mistake here and there can give very different results. So, you will again receive a value that you did not expect at all.
So, the equation of a straight line will help you determine both the value of m and c. However, this can happen for a set of data with two variables. However, you have to estimate the value of Y for a specified value of X. So, we all know that x is the independent variable. On the other hand, y is the dependent variable. The equation clearly shows how the value of y is directly dependent on the value of x. So, you need to pair data. Therefore, prepare two boxes. On one, put the values of x. Now, calculate to find the values of y and write them in the other box. So, you can get an estimate of the values of the dependent variable.

Line of best fit formula
The most accurate way to find the line of best fit is by the least squares method.
So, use the following steps to find the equation of line of best fit for a set of ordered pairs (x1, y1), (x2, y2) … (xn, yn) (x1, y1), (x2, y2) … (xn, yn).
Step 1: Calculate the mean of the xx -values and the mean of the y-values.
X¯¯¯=∑i=1nxinY¯¯¯=∑i=1nyinX¯=∑i=1nxinY¯=∑i=1nyin
Step 2: The following formula gives the slope of the line of best fit:
m=∑i=1n(xi−X¯¯¯) (yi−Y¯¯¯) ∑i=1n(xi−X¯¯¯)2m=∑i=1n(xi−X¯) (yi−Y¯) ∑i=1n(xi−X¯)2
Step 3: Compute the y-intercept of the line by using the formula:
b=Y¯¯¯−mX¯¯¯b=Y¯−mX¯
Step 4: Use the slope mm and the yy -intercept bb to form the equation of the line.
Line of best fit FAQs
What are the rules that you need to follow to draw the line of best fit?
Ans. So, you need to keep in mind roughly three things to draw the line of best fit.
- You must draw a line of best fit only if there is a strong positiveor negative correlation.
- The line of best fit does not have to pass through the origin.
- The line of best fit shows the trend. However, it is only an Therefore, any readings taken from it will be estimations.
What makes a line of best fit reasonable?
The line of best fit is reasonable because it sets the trend of the data very aptly. This is because ideally, the number of points should be the same on both sides of it.
What is important for drawing a line of best fit?
A line of best fit must take into account all the data in a scatter plot. There might be some stray observations during your physics lab work. However, for a bigger statistical observation, it should not at all happen.